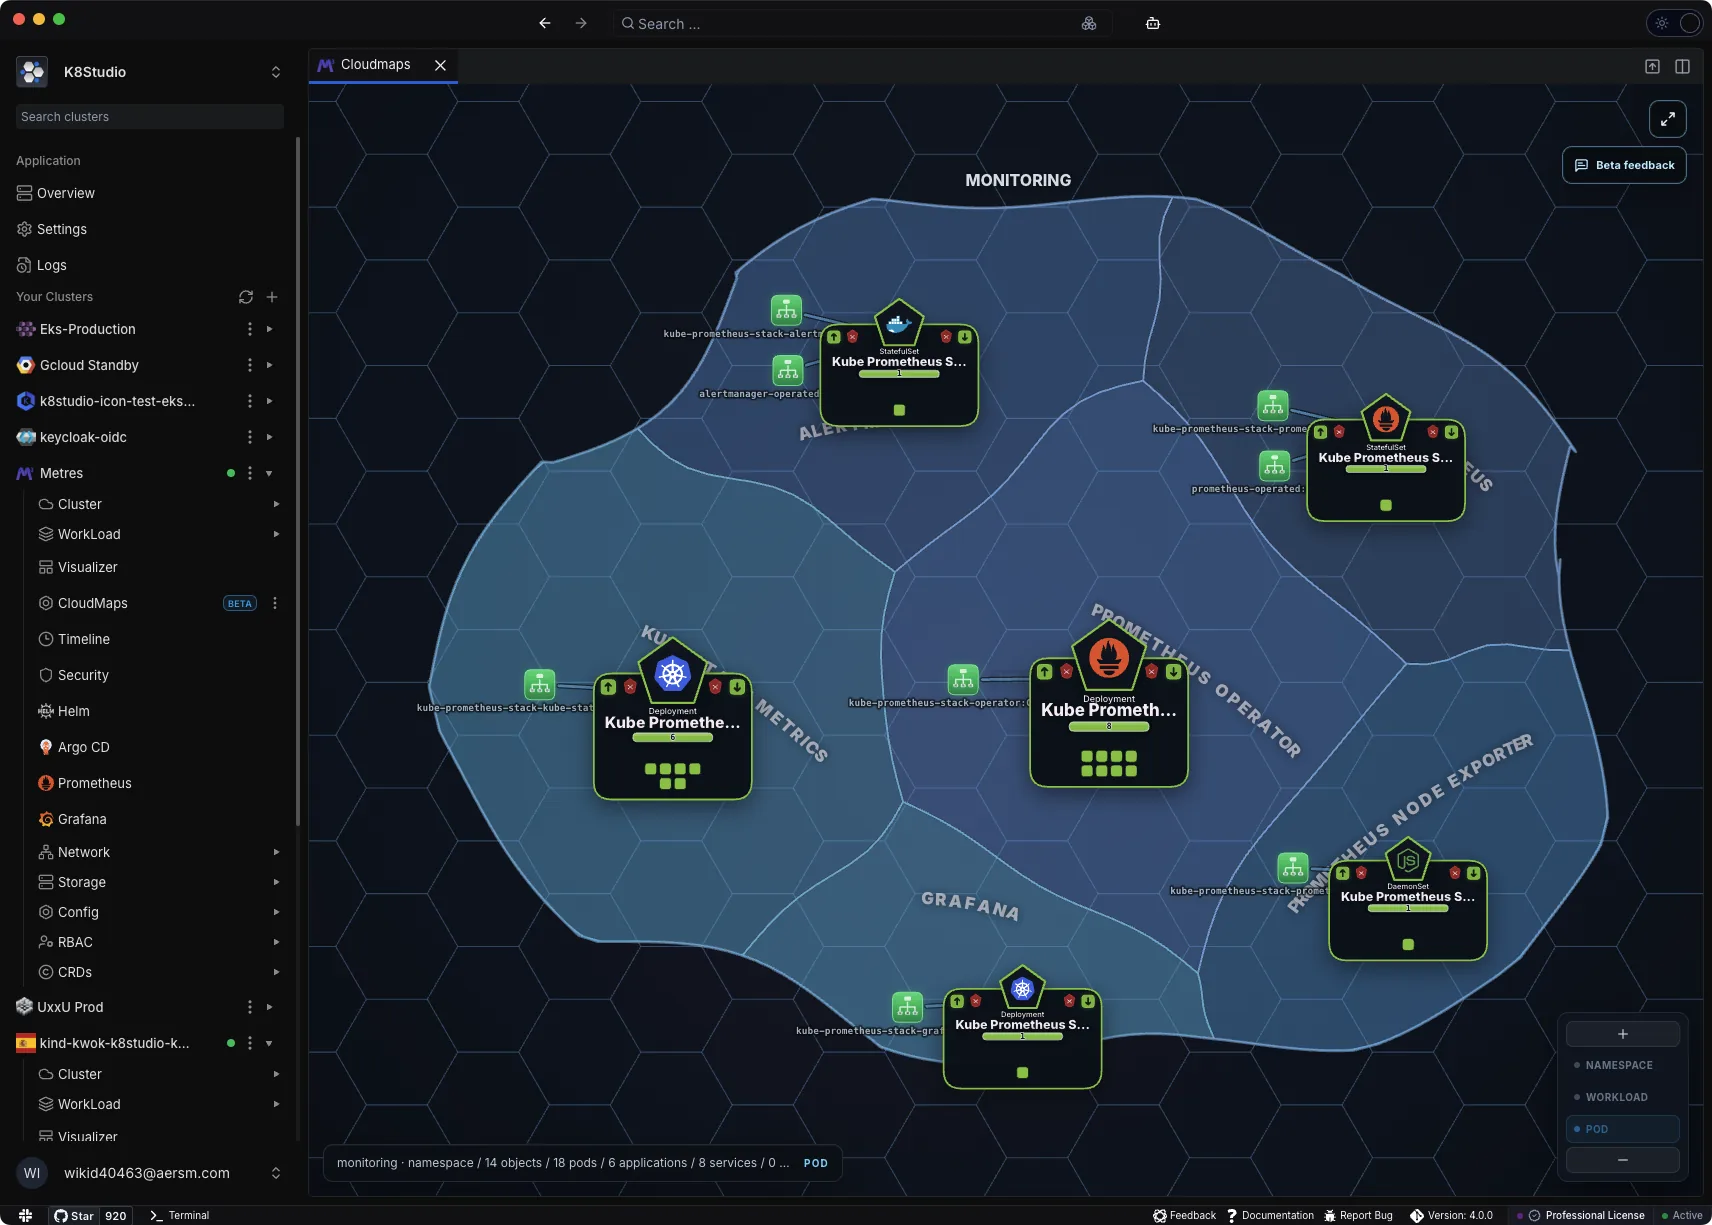
See the structure, not just the list
CloudMaps turns Kubernetes relationships into a map you can read at a glance:
- Namespaces as islands - namespaces stay visually distinct, even when they are small, so they do not disappear inside a merged blob.
- Regions by purpose - related namespaces and tools group into recognizable areas such as monitoring, ingress, platform services, or your own application domains.
- Workloads and pods in context - pods aggregate into the workloads that own them, and workloads sit inside the namespace where they actually run.
- Services, routes, and dependencies - Services, Ingresses, Gateway API resources, policies, routes, and related objects are shown in context instead of as isolated YAML.
- Storage relationships - PVCs and storage dependencies can be followed from the workload that uses them.
- Technology icons - tools such as Prometheus, Grafana, Argo CD, Helm, CoreDNS, and other known ecosystem components are easier to recognize visually.
Zoom without losing where you are
CloudMaps is designed around continuous exploration:
- Start from the whole cluster.
- Zoom into a region.
- Open a namespace island.
- Inspect a workload.
- Follow pods, services, routes, policies, storage, and dependencies.
The goal is to keep your mental model intact. You should not have to jump from one disconnected screen to another just to understand why a workload behaves the way it does.
Built for large clusters
Traditional tree views and resource tables become harder to reason about as clusters grow. CloudMaps is designed for clusters with thousands of workloads by aggregating detail at the right level instead of throwing information away.
At a high zoom level, you see regions, namespaces, resource counts, and health signals. As you zoom in, more detail appears: workloads, pods, services, ports, routes, storage, and live relationships.
Understand relationships and blast radius
CloudMaps helps answer questions that are painful in flat tools:
- What is this workload connected to?
- Which services or routes lead to it?
- Which pods, PVCs, and policies are related?
- What could be affected if this object changes?
- What can this service account or workload reach if something is compromised?
That makes CloudMaps useful for troubleshooting, architecture review, onboarding, and security discussions.
Works with the rest of K8Studio
CloudMaps is not a separate dashboard. It sits inside the same desktop workspace as:
- Object Topology
- Events Timeline
- Workload grids
- Logs
- Security views
- RBAC
- Helm
- Argo CD
- Prometheus
- Grafana
Because K8Studio connects through your existing kubeconfig, CloudMaps works without installing agents, sidecars, operators, or collectors in your cluster.
For more context, read why we built Google Maps for Kubernetes, compare the best Kubernetes cluster visualization tools for 2026, review maintained Weave Scope alternatives, or inspect per-object topology alongside the cluster-wide map.
CloudMaps is currently in beta and continues to evolve based on real cluster feedback.
CloudMaps is included during the active 15-day Professional trial and in the Professional and Professional Airtight plans. It is not included in Basic after the trial.