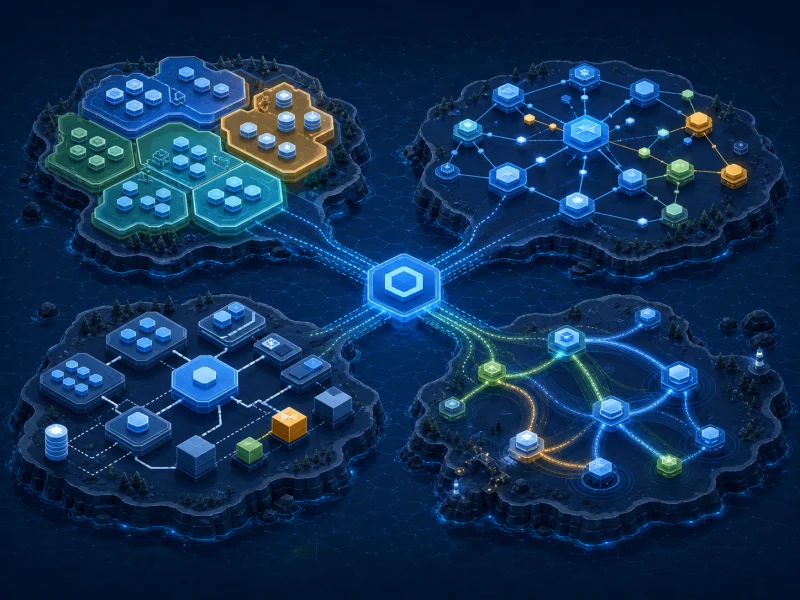

Quick answer: The best Kubernetes cluster visualization tool depends on what you need to understand. Use CloudMaps for a live, agent-free map that keeps namespaces, workloads, pods, services, routes, policies, and storage in spatial context. Use KubeView for a lightweight read-only resource graph, KubeDiagrams for generated architecture diagrams, Kiali for service-mesh traffic, and Headlamp when you need a broader web UI rather than a dedicated map.
Explore CloudMaps, Google Maps for Kubernetes
What counts as Kubernetes cluster visualization?
The phrase covers several different jobs that are often grouped together:
- Live cluster maps preserve location and health while you move from a cluster overview into namespaces, workloads, and pods.
- Resource relationship graphs show ownership and references between Kubernetes objects.
- Architecture diagram generators turn manifests or cluster state into documentation artifacts.
- Service-mesh maps explain request traffic and mesh telemetry.
- General Kubernetes dashboards provide resource lists and operational actions, sometimes with graph plugins.
No single view is best for every job. A useful comparison starts with the question you are trying to answer, not the number of nodes a tool can draw.
Kubernetes visualization tools compared
| Tool | Primary view | Live data | Deployment model | Best fit |
|---|---|---|---|---|
| K8Studio CloudMaps | Zoomable cluster map | Yes | Desktop, kubeconfig, no in-cluster agent | Operations, troubleshooting, onboarding, large clusters |
| KubeView | Resource relationship graph | Yes | Web application connected to the Kubernetes API | Lightweight, read-only topology exploration |
| KubeDiagrams | Generated architecture diagram | On demand | CLI, container, web service, or kubectl plugin | Documentation, reviews, and exportable diagrams |
| Kiali | Service-mesh traffic graph | Yes | Web application using Istio telemetry | Istio traffic, requests, and mesh health |
| Headlamp | General Kubernetes web UI | Yes | Web or desktop application | Broad cluster administration and extensibility |
| Weave Scope | Container and process map | Legacy | In-cluster probes and web UI | Existing installations only; no longer maintained |
The table describes the projects' main use cases, not a universal ranking. Validate security, permissions, scale, and update behavior against your own environment before choosing.
1. CloudMaps: live, agent-free Kubernetes maps
CloudMaps is K8Studio's real-time Kubernetes cluster visualization. It treats the cluster as a map: namespaces remain distinct areas, workloads sit inside their namespace, pods appear as you zoom in, and Services, Ingresses, Gateway API routes, policies, and PVC dependencies connect the relevant objects.
The key difference from a fixed graph is progressive detail. You can begin with the whole cluster, zoom into a namespace, and continue to a workload or pod without replacing the entire screen. That makes the map useful for operational questions such as:
- Which namespaces are unhealthy?
- Which Service or route reaches this workload?
- Which PVC does this workload use?
- What could be affected by this change?
- Is a network policy restricting ingress or egress?
CloudMaps connects with the same kubeconfig used by kubectl. It does not install a DaemonSet, sidecar, operator, CRD, or telemetry collector. Rendering and cluster interpretation happen in the desktop application, which is useful in restricted and air-gapped environments. The current beta is designed and tested for clusters with 5,000 or more workloads.
Choose CloudMaps when: you want a maintained, live map for day-to-day Kubernetes operations without adding software to the cluster.
2. KubeView: a focused resource graph
KubeView describes itself as a lightweight Kubernetes cluster visualization tool. It provides a secure, read-only graph of resources and derived relationships, with real-time updates as resources change.
Its narrower scope is useful when you want a straightforward open-source graph and do not need a full desktop Kubernetes IDE. A graph and a spatial map solve different scale problems, so test readability with the resource count and relationship density of your production clusters.
Choose KubeView when: a lightweight, read-only relationship graph is the main requirement.
3. KubeDiagrams: architecture diagrams from Kubernetes inputs
KubeDiagrams generates architecture diagrams from manifests, Kustomize files, Helm charts, Helmfiles, or actual cluster state. It supports many Kubernetes resource kinds, custom resources, configurable clustering, relationships, and output formats including SVG, PNG, PDF, draw.io, and DOT.
This is a strong fit for documentation, design review, onboarding material, and snapshots that need to be shared outside the live cluster interface. It is a different workflow from continuously navigating a production cluster.
Choose KubeDiagrams when: the deliverable is an exportable architecture diagram or documentation artifact.
4. Kiali: traffic topology for Istio
Kiali visualizes services and traffic within an Istio service mesh. It is useful for request rates, errors, latency, and mesh configuration because it is built around Istio telemetry.
That specialization is also the boundary: a mesh traffic graph is not a complete map of every Kubernetes object. Teams using Istio often pair Kiali with a broader cluster-management or topology tool.
Choose Kiali when: your primary question is how traffic moves through an Istio service mesh.
5. Headlamp: broad Kubernetes web administration
Headlamp is an active, extensible Kubernetes web UI under Kubernetes SIGs. It covers broad resource management and supports plugins, making it a good fit for teams that want a general web interface.
Headlamp is not primarily a category-specific cluster map. Compare it with CloudMaps or KubeView when topology is the central requirement; compare it with other dashboards when general administration is the priority.
Choose Headlamp when: you want an extensible web UI for broad Kubernetes administration.
6. Weave Scope: important history, but no longer maintained
Weave Scope helped establish real-time maps for containers and Kubernetes. Its repository now labels the project deprecated and states that it is no longer maintained. GitHub lists its latest release as April 2021.
Existing deployments may continue to run, but lack of maintenance changes the security and compatibility calculation. New evaluations should start with maintained tools, and existing users should plan a replacement rather than treating Scope as a current default.
Compare maintained Weave Scope alternatives
How to choose
- Define the question. Live troubleshooting, static documentation, mesh traffic, and general administration require different views.
- Check the deployment model. Decide whether the tool may install agents, run in the cluster, use a vendor backend, or stay on an engineer's workstation.
- Test your real scale. Use a representative cluster, not a small demo, and check initial load, pan and zoom, updates, and label readability.
- Verify relationship coverage. Confirm Services, Ingresses, Gateway API routes, PVCs, policies, and custom resources that matter to your platform.
- Review data boundaries. Document where cluster metadata, logs, metrics, and credentials are processed.
- Plan for restricted networks. If you operate offline, verify both application behavior and license validation without internet access.
Frequently asked questions
What is the best way to visualize a Kubernetes cluster?
Use a live topology map when you need operational context, a generated diagram for documentation, and a service-mesh graph for traffic analysis. CloudMaps is designed for live, agent-free exploration from namespaces to workloads and pods.
What is a Kubernetes topology map?
A Kubernetes topology map shows resources and their relationships visually, including namespaces, workloads, pods, services, ingresses, routes, policies, and storage dependencies.
Can I visualize Kubernetes without installing an agent?
Yes. A desktop tool can read the Kubernetes API through your existing kubeconfig and render the cluster locally. K8Studio uses this model and installs nothing in the cluster.
Is Weave Scope still maintained?
No. The project repository states that Weave Scope is no longer maintained, and its latest listed GitHub release is from April 2021.