K8Studio: Kubernetes Events Timeline
The Events Timeline turns raw Kubernetes events into a visual history of what happened, when it happened, and which resources were involved. Instead of scanning a flat event list, you can see warnings, successful lifecycle events, repeated failures, and resource relationships in one time-based view.
Kubernetes events are one of the fastest ways to understand why a rollout is stuck, why a Pod failed to schedule, or why a workload keeps restarting. The problem is that kubectl get events gives you a flat stream. K8Studio turns that stream into an operational timeline.
What the Timeline shows
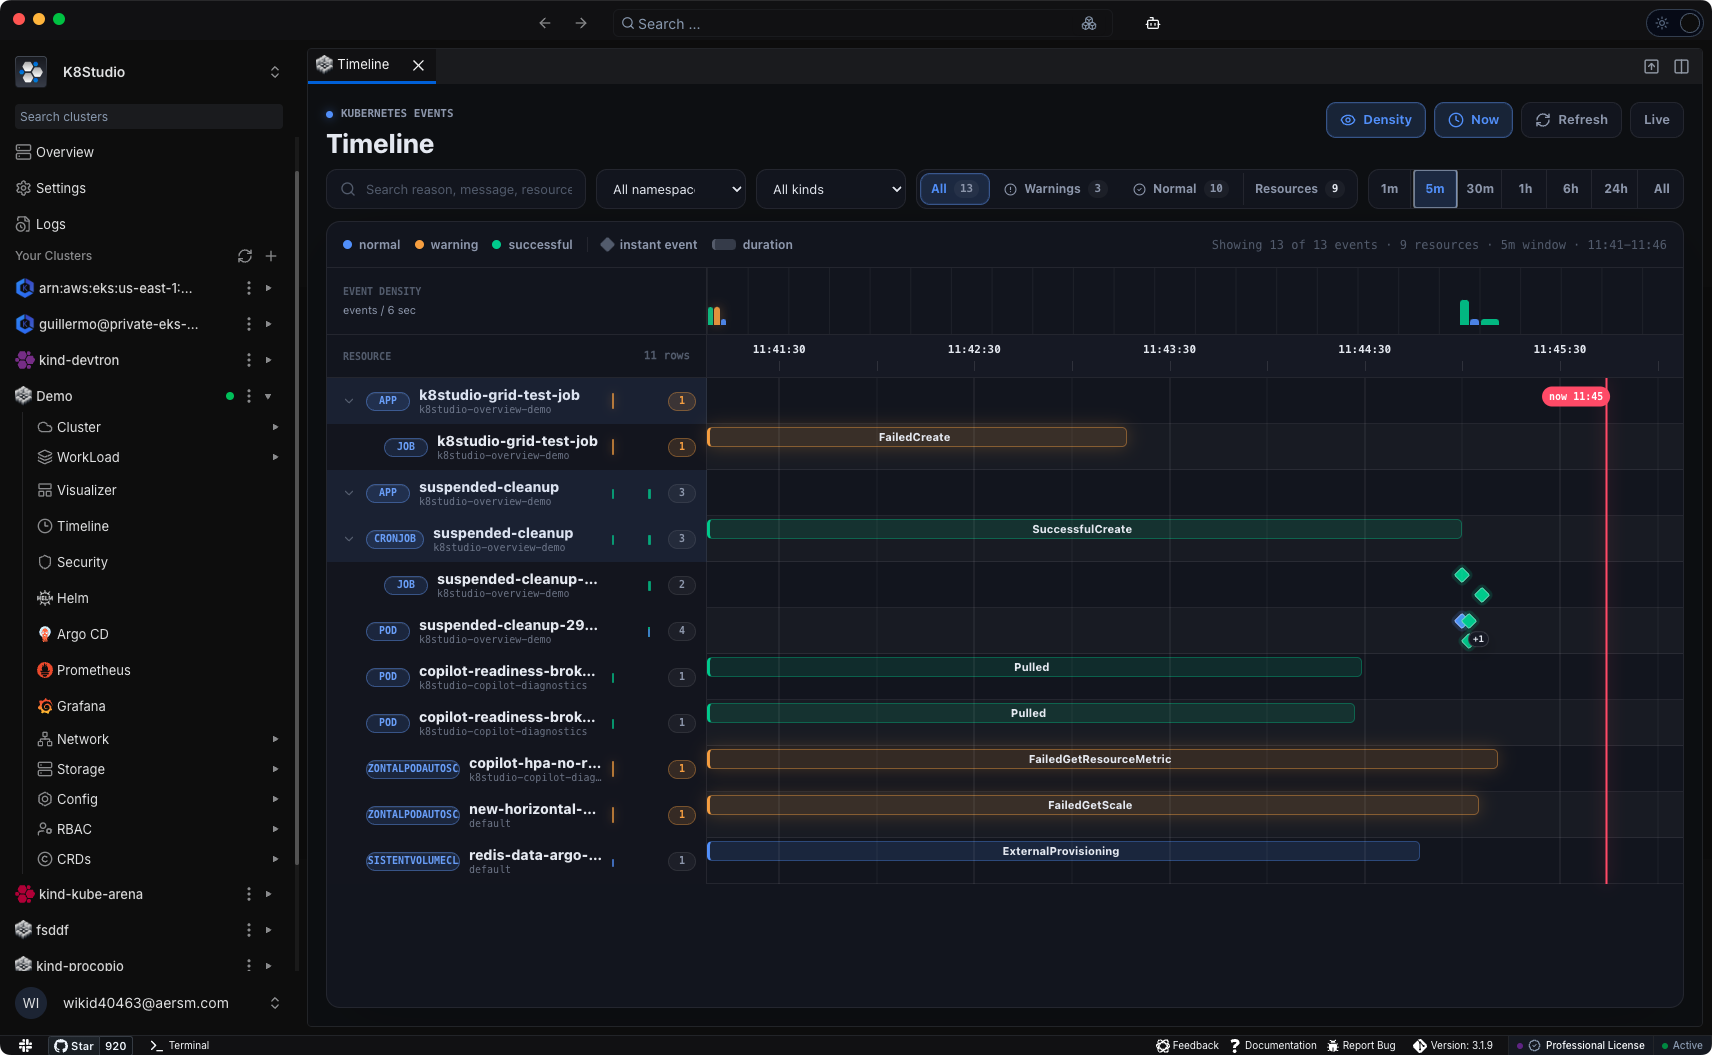
- Events across time: Every event is placed on a horizontal time axis so you can see the order and duration of cluster activity.
- Resource grouping: Related resources are grouped together, such as App to Deployment to ReplicaSet to Pod, or CronJob to Job to Pod.
- Warnings that stand out: Warning events like BackOff, FailedMount, FailedCreate, FailedScheduling, and Unhealthy are visually separated from normal lifecycle events.
- Instant and duration events: One-time events appear as points. Repeating or extended events appear as bars, showing how long the condition persisted.
- Density view: A compact event-density strip helps you spot bursts of activity or warning spikes without manually scanning every row.
- Filters for real clusters: Narrow the view by namespace, kind, severity, search text, and time range.
When to use it
- Debug a rollout that paused or failed halfway through.
- Find when a warning started and which resources were affected.
- Trace a CronJob from schedule to Job to Pod.
- See whether an issue was a brief transient event or a sustained failure.
- Review warning activity before and after a configuration change.
Built into the cluster view
The Events Timeline reads from the Kubernetes Events API using your existing K8Studio connection. No agent, collector, or in-cluster installation is required.