K8Studio: Grafana Integration for Kubernetes Dashboards
K8Studio brings Grafana into the same desktop workflow as your clusters, logs, and metrics. When a Grafana service is present, K8Studio can detect it, open it through a local port-forward, and expose the relevant access details so dashboards stay close to the operational context that sent you there.
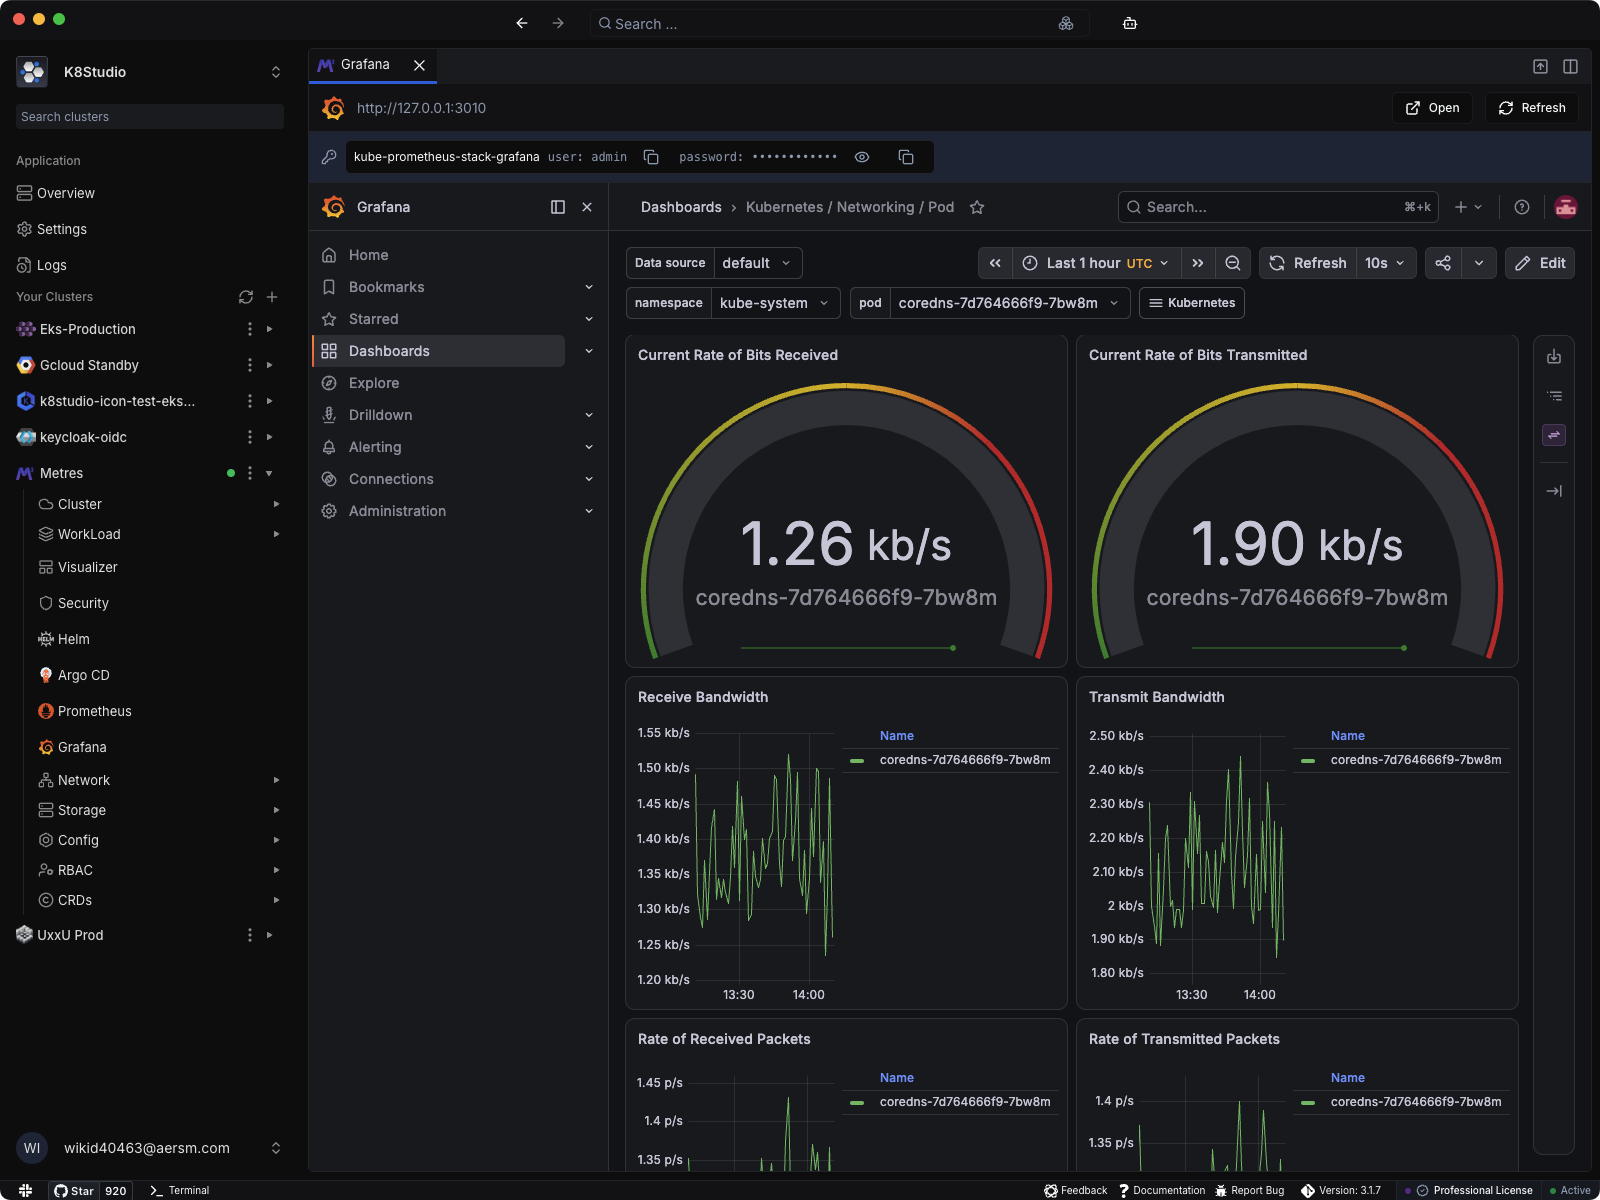
Grafana is where many teams go to confirm whether a problem is real, recent, isolated, or spreading. K8Studio shortens that path by integrating Grafana directly into the cluster workbench. You can inspect the cluster, open Grafana, and move through dashboards without switching tools or manually rebuilding local access.
How the integration works
- Grafana service discovery: K8Studio detects dashboard-facing Grafana services in the cluster and avoids unrelated renderer or metrics endpoints.
- Local port-forwarded launch: Grafana opens through a localhost URL on your machine, so access stays local to your desktop session.
- Embedded dashboard experience: Open Grafana inside K8Studio and keep dashboards next to the cluster tree, workloads, and troubleshooting views.
- Credential assistance from cluster secrets: When Grafana admin credentials are available in cluster secrets, K8Studio can surface them in the integration header to reduce login friction.
- Open and refresh actions: Stay in the embedded view or open the same local dashboard session in your external browser when you need more room.
Why teams use it
- Faster verification loops: Move from a Kubernetes object to the relevant dashboard without stopping to reconfigure access.
- Less context switching: Metrics and dashboard inspection stay inside the same desktop workspace as logs, workload views, and CloudMaps.
- Practical for local and secured clusters: The integration works through local forwarding instead of assuming a public Grafana endpoint is already exposed.
- Better observability flow: Use K8Studio to find the workload, then open Grafana to confirm bandwidth, packet rate, latency, or other runtime behavior in context.
One cluster workbench, not a pile of tabs
Grafana is more useful when it is part of the same investigation path as the rest of your Kubernetes tooling. K8Studio keeps that path intact by treating dashboards as an integrated cluster surface, not a separate destination.