K8Studio: Advanced Log Viewer for Kubernetes Debugging
The Advanced Logs view in K8Studio is built for the real Kubernetes debugging workflow: single pods, multi-container pods, full workloads, and even CronJobs. Instead of dropping you into one raw `kubectl logs` stream at a time, it gives you a structured desktop log surface with aggregation, live tailing, time controls, search, filtering, timestamp formatting, and export - all without installing anything in the cluster.
Logs are context-aware, not just text output
K8Studio opens logs in a dedicated logs app inside the desktop client. That matters because the app is not only showing log text. It is also deciding:
- which Kubernetes resource you selected
- whether that resource is a Pod, a workload, or a CronJob
- whether logs should be live or snapshot-based
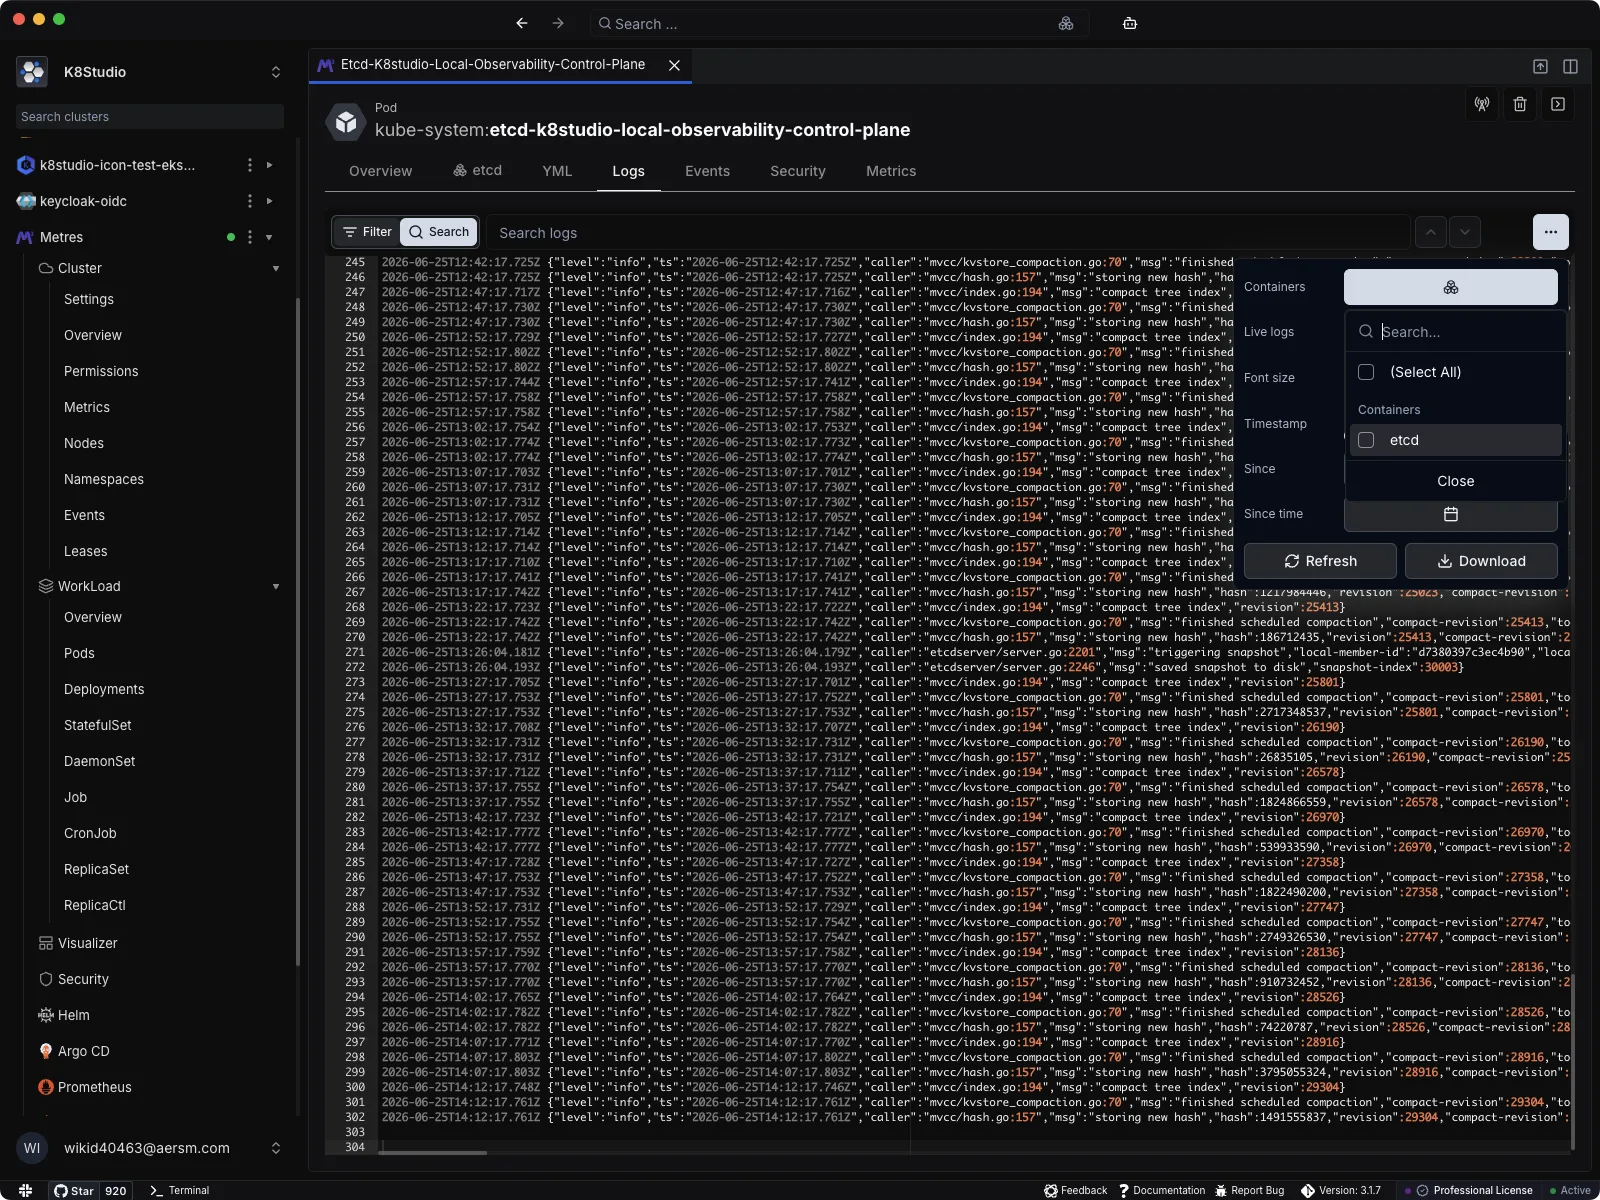
- which pods, jobs, or containers should be included
- how timestamps should be displayed
- whether the visible text should be filtered, searched, or exported
This is why the logs experience feels closer to an operational tool than a thin wrapper around a terminal command.
Pod logs, workload logs, and CronJob logs are handled differently
For a Pod, K8Studio can:
- open logs for the pod directly
- switch between all containers or a selected container
- tail live logs or load a static snapshot
For a workload such as a Deployment, StatefulSet, ReplicaSet, Job, or DaemonSet, K8Studio can:
- aggregate logs across multiple owned pods
- preserve pod and container identity in the output
- let you narrow the view to selected pods or containers
For a CronJob, K8Studio first resolves the Jobs owned by the CronJob and then the Pods owned by those Jobs. That lets the logs view work on the actual runtime objects instead of pretending the CronJob itself is the log source.
K8Studio can use different log backends
The logs controller supports multiple command adapters, including:
- stern
- kubectl
- kubetail
That adapter layer lets K8Studio choose the best command format for the selected resource and current settings. The result is that the UI can keep one consistent experience while the underlying command strategy changes based on your environment and preferred tool.
Live mode and snapshot mode are separate workflows
The Live toggle is a first-class control in the toolbar.
When live mode is enabled, K8Studio follows the stream and keeps appending new lines into the editor. When live mode is off, it loads a snapshot that you can inspect more calmly, refresh manually, and search without a constantly moving target.
That distinction is useful because production debugging usually flips between two modes:
- watch what is happening right now
- analyze a bounded slice of output
K8Studio supports both without forcing the same interface on each workflow.
Filtering and searching are intentionally different
The logs toolbar has both Filter mode and Search mode.
Filter mode
Filter mode changes which lines remain visible. It can narrow the visible output by:
- free-text keyword
- selected pod
- selected job
- selected container
Search mode
Search mode does not remove lines. Instead, it:
- highlights matches
- tracks how many matches exist
- lets you jump to next and previous matches
- reveals the active match inside the editor
That split matters. Filtering reduces noise. Searching navigates what is still visible.
Timestamps can be shown the way humans actually need them
K8Studio supports three timestamp display modes:
- UTC
- Local
- Off
The logs controller reformats timestamps after log text arrives, so the app can keep the same raw data while changing how time is rendered for the viewer. It also collapses duplicated leading timestamps when an underlying command produces overlapping prefix and log timestamps.
This makes aggregated logs much easier to read, especially when multiple pods are streaming at once.
The editor is optimized for real log streams
The logs panel uses an editor surface instead of a plain text block. That gives K8Studio a few useful behaviors:
- color treatment for log sources and common severity words
- append-in-place updates for live streams
- auto-scroll when you are already at the end
- a go to end action when you scroll upward
- persistent font size control
- download of the currently visible log buffer
The controller also buffers log appends before flushing them into the UI, which helps keep the editor responsive when logs are arriving quickly.
Pod names inside logs can become navigation
For pod and workload log views, K8Studio scans known pod prefixes in the output and can turn those pod names into clickable markers. That lets you jump from the log line into the pod itself, which is a small but powerful bridge between runtime output and the object you need to inspect next.
Why this matters
Most Kubernetes logging pain is not caused by the absence of logs. It is caused by fragmentation:
- one pod at a time
- one container at a time
- one terminal session at a time
- one mental model for timestamps, prefixes, and ownership at a time
K8Studio reduces that fragmentation. It keeps the logs local, agent-free, and close to the rest of your Kubernetes workflow, so the step from “I saw something odd in the logs” to “I know which pod, container, or workload I need to inspect next” is much shorter.