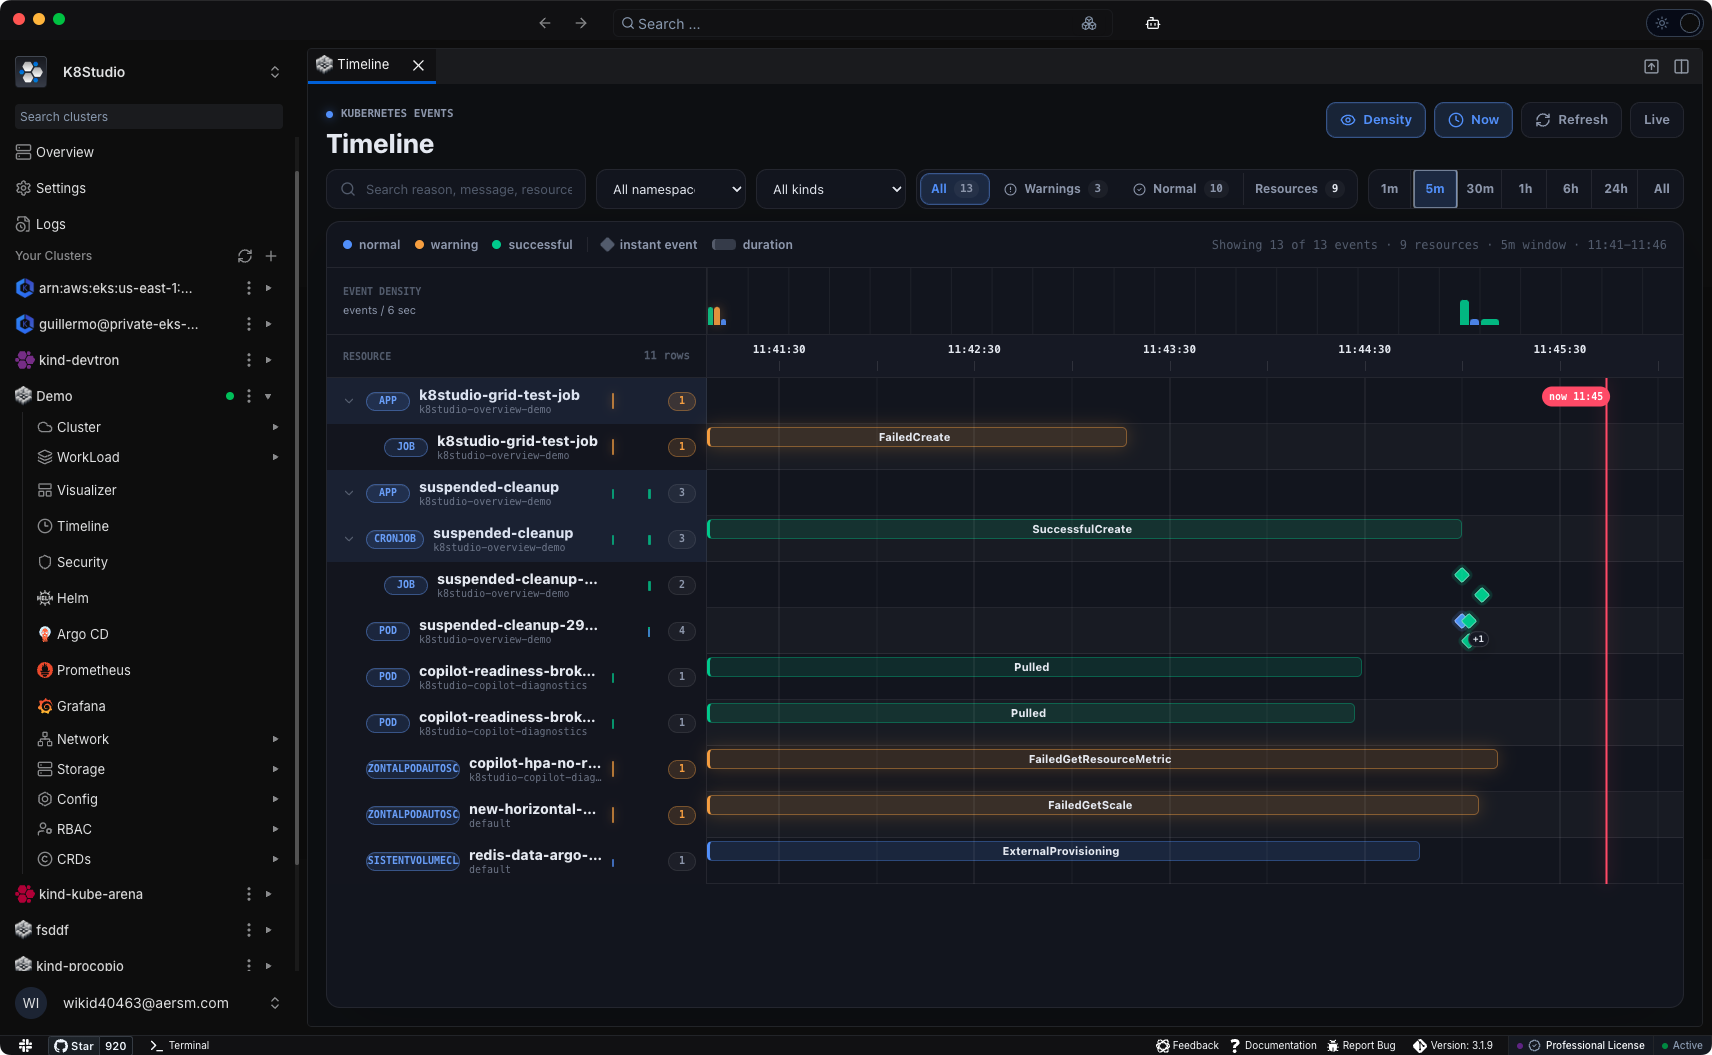

K8Studio's new Events Timeline turns raw Kubernetes event data into a clear, scrollable history of what happened, when, and to which resources.
The problem with reading events line by line
Kubernetes events contain some of the most useful diagnostic information in your cluster. When a pod fails to schedule, an image can't be pulled, or a mount keeps failing, the events stream is usually the first place to look.
The problem is that kubectl get events returns a flat list, sorted by time, with no grouping and no sense of density. When you're dealing with a busy cluster with multiple namespaces, dozens of deployments, and rolling updates happening in parallel, reading that list is slow and error-prone. You end up manually correlating timestamps, resource names, and event reasons in your head.
The Events Timeline in K8Studio 3.1.9 is built to solve this directly.
What the Timeline shows
The Timeline visualizes events from the Kubernetes Events API. This is not logs, not metrics, and not audit data. It is the native Kubernetes event stream, displayed as a visual history across time.
Every event is placed on a horizontal axis representing time. Resources are grouped in a hierarchical tree on the left:
- App → Deployment → ReplicaSet → Pod
- CronJob → Job → Pod
- DaemonSet → Pod
- Nodes and standalone resources appear in their own rows
This grouping means you can collapse an entire application to a single row when you need the high-level picture, then expand into the exact pod or ReplicaSet where a warning occurred.
Warning events stand out clearly
Not all events carry the same weight. The Timeline distinguishes between Normal events, such as successful lifecycle steps like Scheduled, Pulled, Created, and Started, and Warning events, such as BackOff, FailedMount, Unhealthy, FailedCreate, and others.
Warning events are highlighted visually so they don't get buried in routine lifecycle activity. When a cluster is going through a rolling update and something starts going wrong in parallel, you can see the two patterns side by side without filtering manually.
Instant events and duration events
Kubernetes events don't all behave the same way. Some happen once and move on, like a pod getting scheduled or a container starting. Others repeat over time, like a BackOff or FailedMount that keeps firing every few seconds.
The Timeline handles both:
- Instant events are shown as a point in time.
- Repeating or extended events are shown as a bar spanning their actual time range, so you can see how long a problem persisted before it resolved or before a pod was killed.
This distinction matters when you're trying to understand whether a warning was a brief transient or a sustained failure.
Filtering and density views
For large clusters, the Timeline includes:
- Filtering by namespace, resource kind, event severity, and time range
- Search to narrow to specific resources or event reasons
- Density views to spot time windows with heavy warning activity at a glance
The Timeline is designed to remain usable as clusters grow. It handles large event sets without becoming sluggish or visually unreadable.
When to use the Events Timeline
- Investigating why a rollout paused or failed partway through
- Finding out when a node became unready and which pods were affected
- Understanding whether an image pull failure was an isolated incident or a recurring problem
- Tracing the lifecycle of a CronJob and its individual job runs
- Reviewing warning activity across a namespace before and after a configuration change
- Onboarding new team members to the actual runtime behavior of a cluster
Availability
The Kubernetes Events Timeline is available in K8Studio Professional and during the trial period. No additional configuration is required. It reads from your cluster's Events API using your existing connection.
Download K8Studio 4.0.3 and open the Timeline from the cluster view.