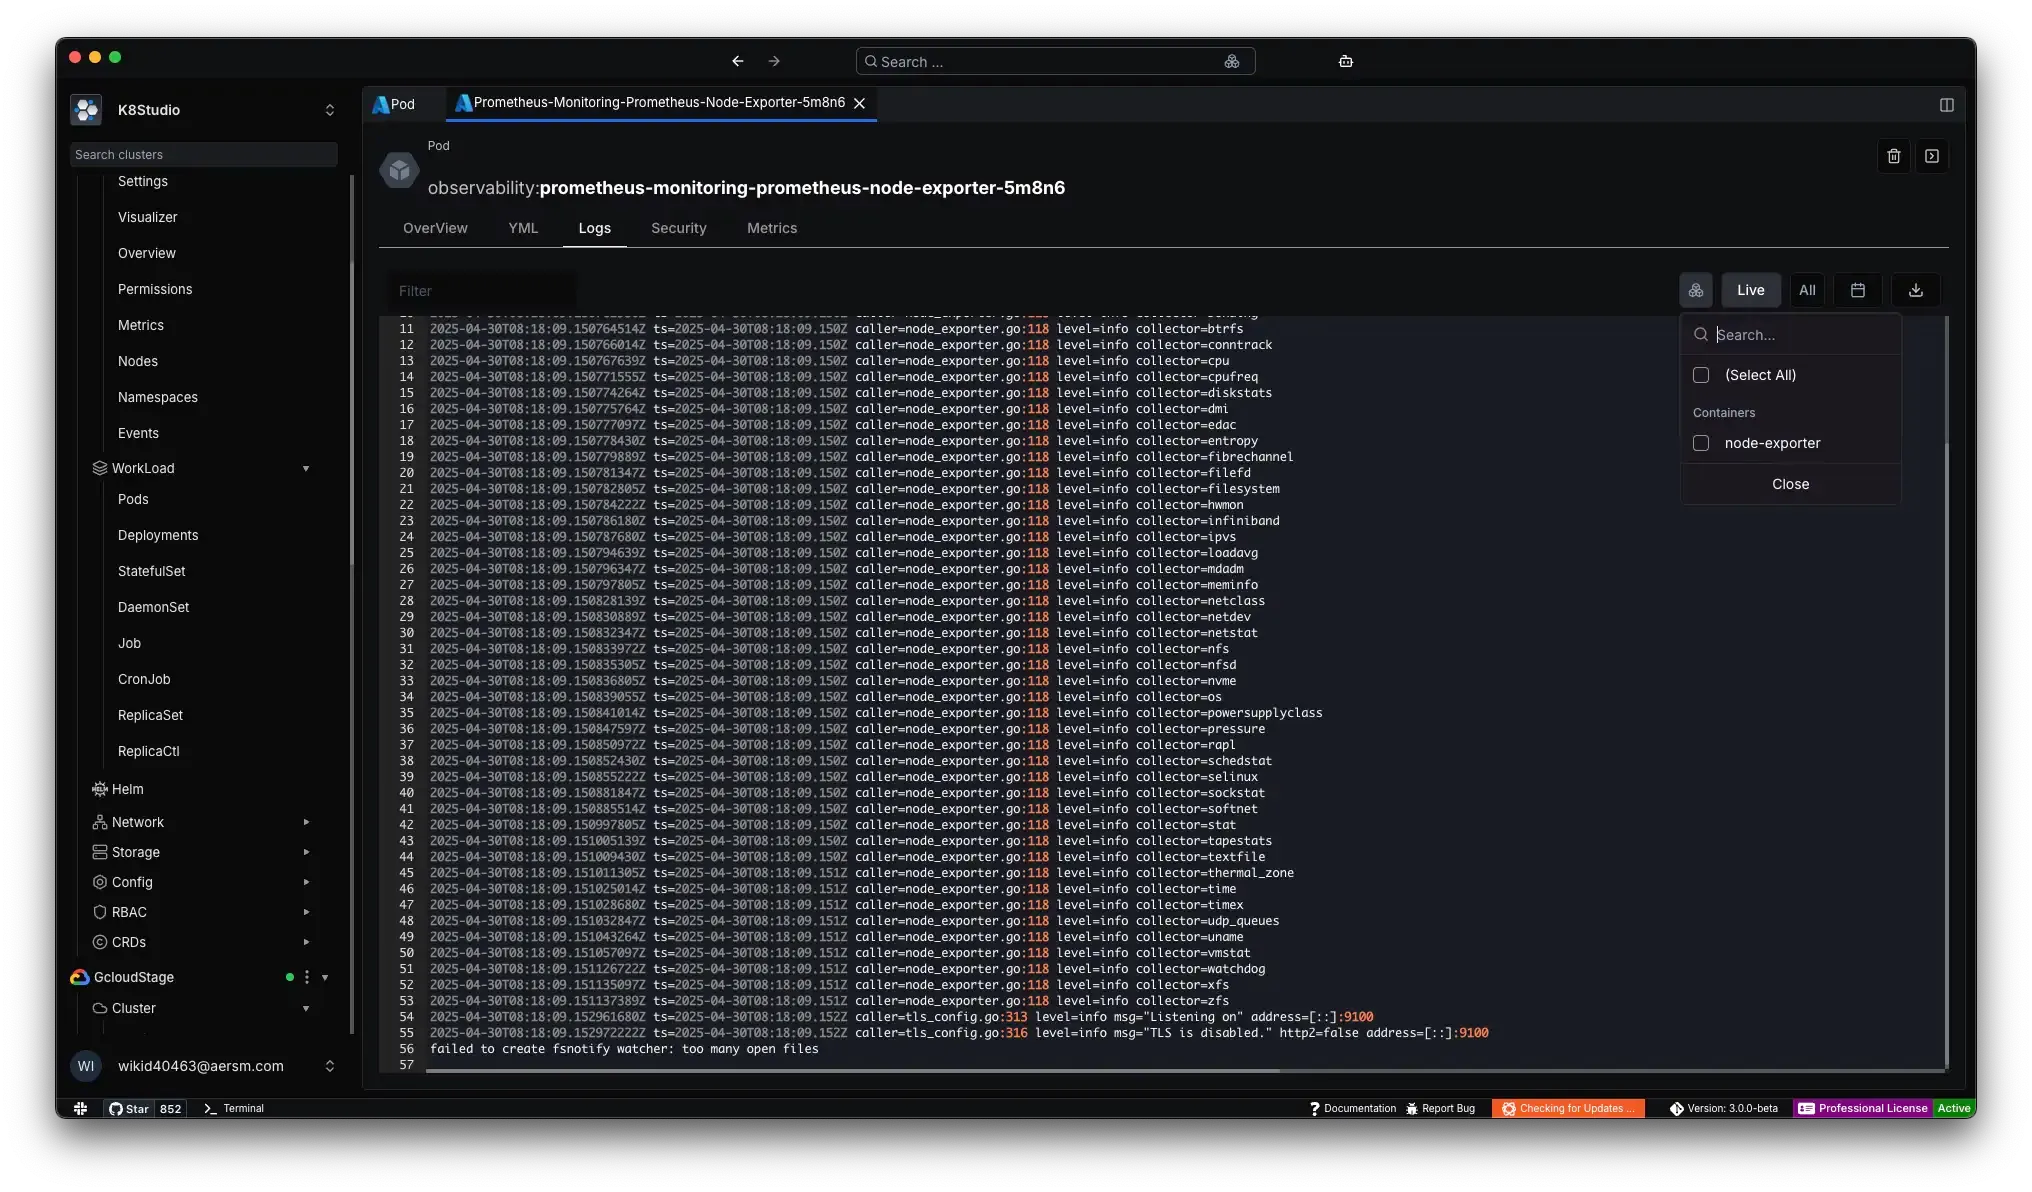

K8Studio's logs view is more than a text panel attached to a pod. It is a small log system inside the desktop app that decides how to fetch logs, how to aggregate them, how to filter them, and how to keep the UI responsive while new lines are still arriving.
This article explains how that works in practice.
1. The logs view is its own app inside K8Studio
Inside the desktop client, logs are handled by a dedicated plugin: app/src/plugins/k8s-logs.
That plugin has three main pieces:
- a controller that decides what command to run and when to refresh
- a model that stores state such as live mode, time range, filters, and timestamp mode
- a UI layer that renders the editor, toolbar, search matches, pod links, and download action
That separation matters because the logs view is doing two jobs at once:
- it has to read raw log output coming back from Kubernetes
- it has to keep the visible editor fast enough to use while the output is still changing
2. K8Studio does not use only one logging backend
The logs controller chooses a log command adapter based on the app settings.
Today the code supports:
sternkubectlkubetail
The controller reads the preferred adapter from the log settings and uses the matching command builder before it starts the shell process.
That is an important design detail. K8Studio's logs view is not hard-wired to one command format. It has a small adapter layer that lets the app build the right command for the selected resource and the selected logging tool.
3. Pod logs and workload logs are handled differently
If you open logs for a single Pod, the command is straightforward:
- K8Studio targets that pod directly
- it can read all containers or a selected container
- it can switch between live follow mode and a static snapshot
If you open logs for a workload such as a Deployment, StatefulSet, ReplicaSet, DaemonSet, or Job, the behavior changes:
- K8Studio can aggregate logs across multiple pods
- it can include all containers or a selected container
- it can prefix lines so the source pod or container stays visible
With stern, the app builds a pod query or workload target and lets Stern stream the combined output.
With kubectl, it can target a label selector or workload target and request logs with --prefix=true so the output still tells you where each line came from.
That is why workload logs in K8Studio feel different from running a single kubectl logs command manually. The app is doing the aggregation step for you.
4. CronJobs need special handling
CronJobs are a special case because the logs do not belong to the CronJob object itself. They belong to Jobs created by the CronJob, and then to Pods created by those Jobs.
K8Studio handles that by:
- looking up Jobs owned by the CronJob
- resolving the Pods that belong to those Jobs
- building a log command from the owned pod set
If no pods are found, the app returns a readable message instead of leaving the panel blank.
This is one of the places where the logs view is doing real Kubernetes-specific work rather than just wrapping a terminal.
5. Live mode and snapshot mode are first-class controls
The toolbar exposes a Live toggle.
When live mode is enabled:
- the adapter builds a follow command
- the controller keeps appending new data as it arrives
- the UI shows a loading indicator such as "Connecting live logs"
When live mode is disabled:
- the app fetches a static snapshot
- the toolbar still lets you refresh manually
- the editor behaves more like an inspectable log capture than an active tail
This distinction is important because searching and filtering a stable snapshot is a different workflow from watching a deployment fail in real time.
6. The app keeps raw logs separate from visible logs
One of the more useful implementation details in the controller is that it keeps:
- raw log data
- displayed log data
- filtered visible data
as separate concepts.
Why?
Because K8Studio lets you change things like:
- keyword filters
- resource filters
- timestamp display mode
without always having to re-fetch everything from the cluster.
If the app already has the raw text, it can rebuild the visible output locally in many cases. That is faster and keeps the UI more responsive.
7. Search and filter are not the same feature
The logs toolbar has two text modes:
- Filter
- Search
They behave differently.
Filter mode
Filter mode changes which lines are visible at all.
The controller applies a log filter helper that can reduce the visible output by:
- free-text keyword
- selected pod
- selected container
- selected job in a CronJob flow
In other words, filter mode is a visibility reducer.
Search mode
Search mode does not remove lines. It keeps the current visible text and adds:
- highlighted matches
- next / previous navigation
- active match tracking
- automatic reveal of the selected match
So search mode is a navigation layer, not a fetch or filter layer.
That separation makes the logs panel much easier to use when the output is large.
8. Resource filters are generated from the selected object
The filter dropdown is also context-aware.
K8Studio generates filter options differently depending on what you selected:
- for a Pod, it offers containers
- for a workload, it offers pods and containers
- for a CronJob, it offers jobs and containers
This means the logs view is not showing one fixed filter UI for every resource type. It builds the filter model from the selected Kubernetes object and its relationships.
9. Timestamps can be shown in UTC, local time, or turned off
The logs toolbar supports three timestamp modes:
- UTC
- Local
- Off
The controller reformats timestamps after the raw text arrives.
That means the app does not need the cluster to emit logs in one exact visual format. It can:
- keep timestamps in canonical UTC style
- convert them to local machine time for easier human reading
- remove timestamp rendering when you want the cleanest possible text stream
The timestamp utility also collapses duplicated leading timestamps when a command produces overlapping prefix and log timestamps.
That small cleanup step matters because aggregated logs can otherwise become noisy very quickly.
10. The editor is optimized for ongoing log streams
The logs UI uses an editor view rather than a plain <pre>.
That editor layer gives K8Studio a few important behaviors:
- syntax-like highlighting for timestamps, error words, warnings, debug lines, IPs, and plugin names
- append-in-place updates for live logs
- auto-scroll when you are already at the bottom
- a "go to end" button when you scroll upward and break auto-scroll
- persistent font size control stored in local settings
The controller also buffers appends before flushing them into the UI. That reduces unnecessary repaint churn when log lines are arriving quickly.
11. Pod names inside the logs can become clickable
For pod and workload log views, K8Studio scans the visible log text for known pod prefixes and turns those pod names into interactive markers.
That lets the logs panel act like a navigation surface:
- hover a known pod name
- click it
- jump into the pod from the logs view
This is a small feature, but it is a good example of the desktop app treating logs as structured operational context rather than passive text.
12. Download means the visible log output
The Download logs action creates a text file from the current displayed log buffer.
In practice, that means what you export is the text as the app currently has it available in the panel, not some separate hidden server-side export flow.
That keeps the action simple and predictable:
- inspect
- filter or narrow if needed
- download what you are looking at
13. The overall design goal is practical, not magical
The logs feature in K8Studio is doing a few concrete things well:
- choosing the right backend command for the selected resource
- aggregating workload logs when the resource is not a single pod
- handling CronJob ownership correctly
- separating fetch, display, filter, and search concerns
- keeping the desktop UI responsive while live output is still arriving
That is why the logs view feels more like a real operational tool than a thin wrapper around kubectl logs.
It still respects the underlying Kubernetes model, but it removes a lot of the manual stitching engineers normally do by hand.
If you want, I can turn this into a second companion article focused only on the user workflow side: selecting workloads, narrowing pods and containers, using time filters, and downloading the right slice of logs when debugging a production issue.