Monitoring & Metrics
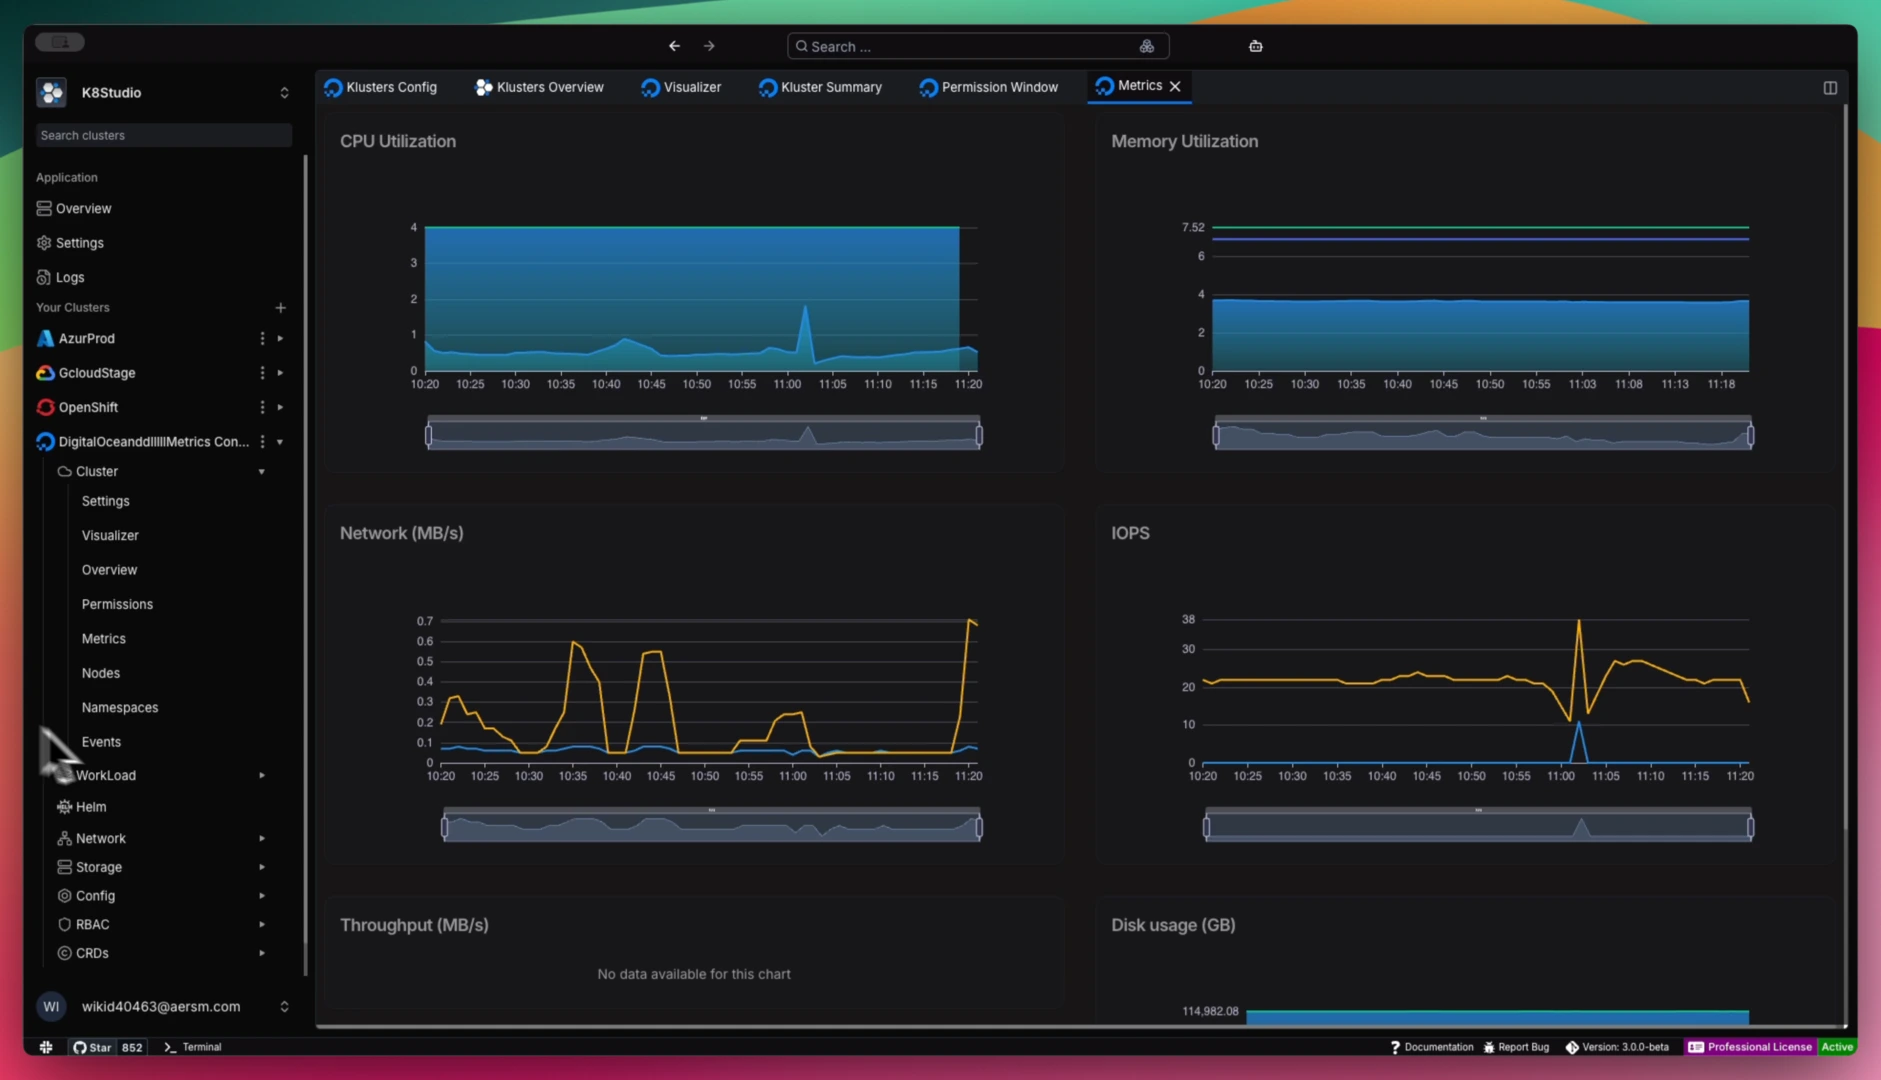
Node Metrics in K8Studio provide essential insights into the performance and health of Kubernetes nodes within your cluster. By leveraging metric services such as Prometheus, administrators can monitor crucial metrics like CPU usage, memory utilization, storage usage, and network traffic across nodes.
Key Features
- Node Metric Monitoring:
- Ensure the metric service is installed in your Kubernetes cluster to enable node metric monitoring.
- Navigate to the NodeView within K8Studio.
- Select a specific node to view detailed metrics.
- Access node metrics such as CPU usage, memory utilization, storage usage (including request and limit metrics), and network traffic.
- Workload Metrics Configuration:
- Enable workload metrics by installing Prometheus on your Kubernetes cluster.
- Configure K8Studio to recognize the Prometheus service port and namespace where metrics data is available.
- Access cluster settings within K8Studio and select "Metric Services" to configure Prometheus integration.
- Viewing Workload Metrics:
- Once Prometheus is configured, view workload metrics by selecting any workload (e.g., deployments, pods) within K8Studio.
- Navigate to the side editor and choose the "Metric" tab to access detailed Prometheus metrics.
- Monitor metrics related to CPU usage, memory utilization, storage requests and limits, and network traffic for individual workloads.
- Cluster Metrics:
- Gain comprehensive insights into overall cluster health and performance.
- View aggregated metrics across all nodes and workloads within the cluster.
- Monitor CPU utilization, memory usage, storage allocation (including requests and limits), and network traffic to ensure optimal cluster performance and resource allocation.