K8Studio: Cluster Overview for Kubernetes Management
The Cluster Overview Page offers a centralized, real-time dashboard for monitoring the overall health and performance of your Kubernetes cluster. It provides instant visibility into critical metrics such as **CPU usage**, **memory consumption**, and **pod utilization**, allowing users to assess resource allocation and demand across the cluster with clarity and precision.
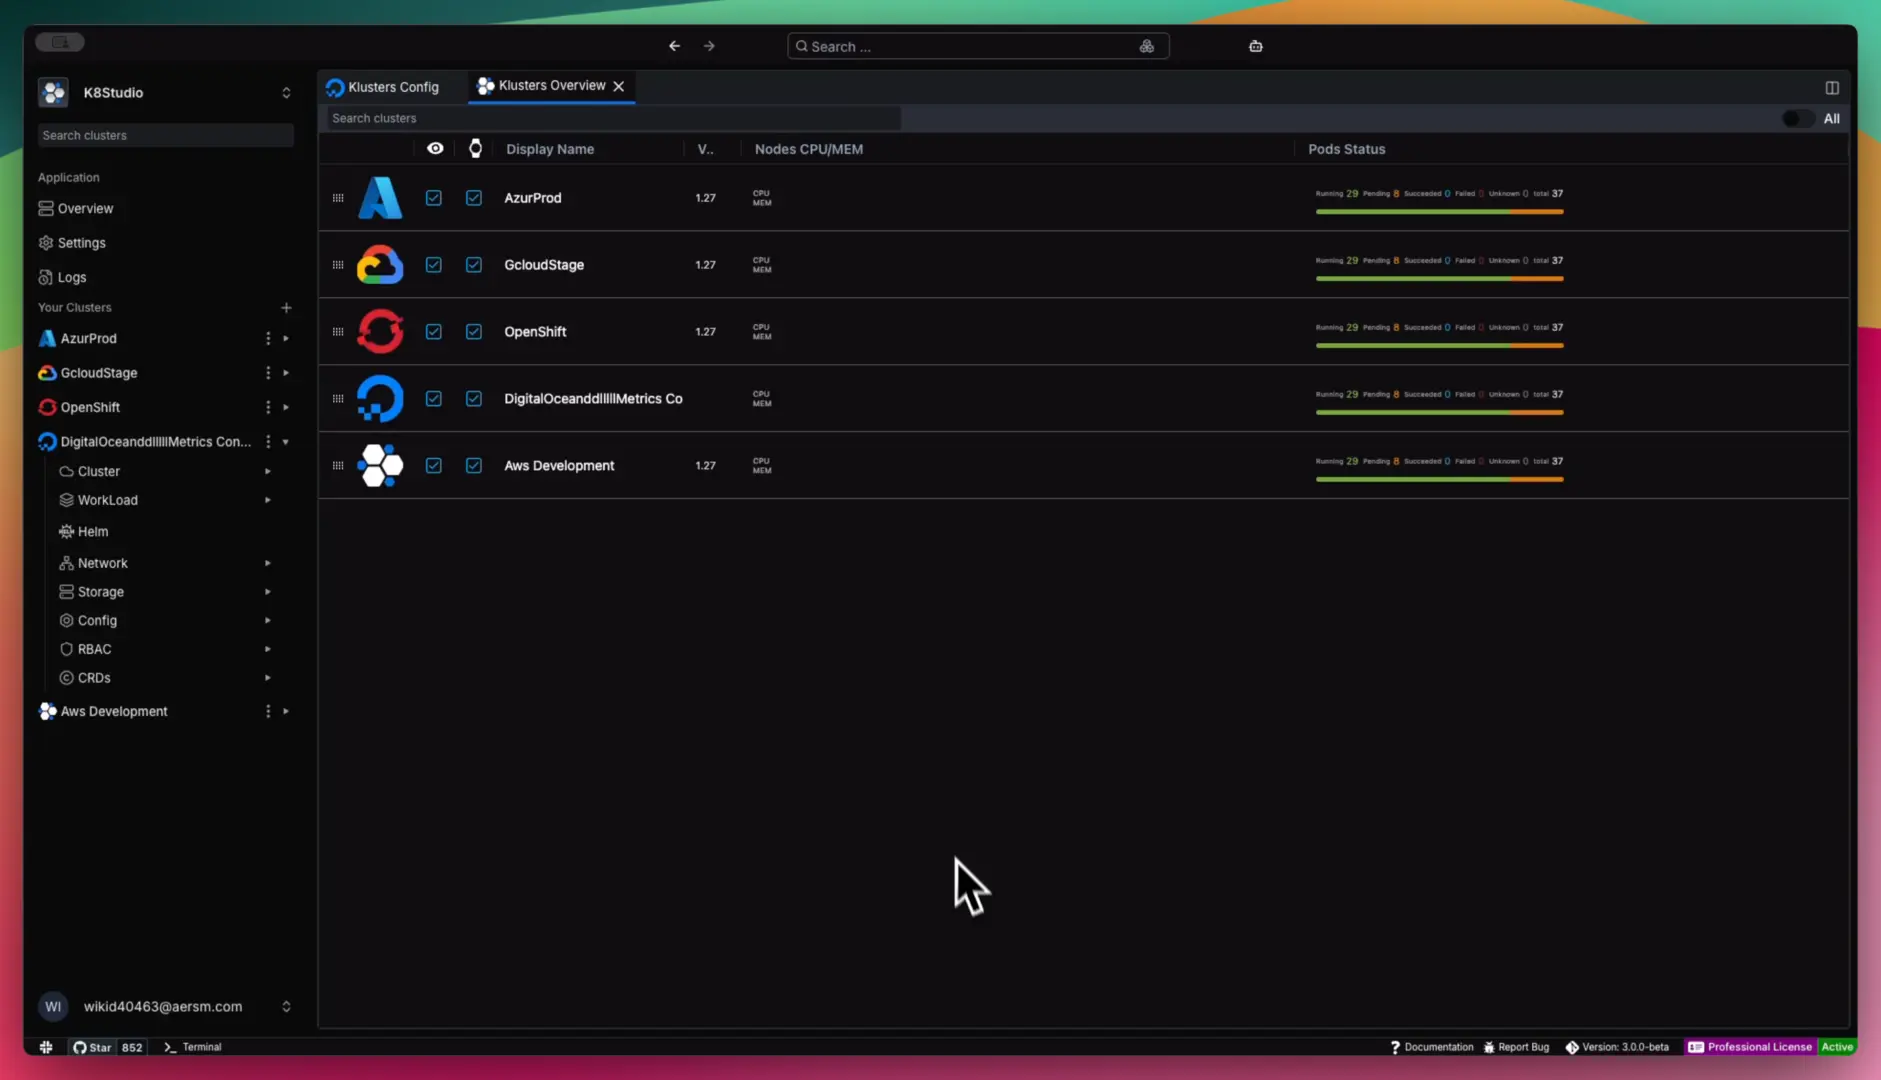
Designed to support both high-level summaries and deeper operational insights, the page presents key data points including requested vs. allocated resources, usage limits, and actual consumption in a streamlined, visual format. It also includes a breakdown of pod allocation and status by namespace, giving teams a clearer view of workload distribution and operational status across environments.
In addition to cluster-wide metrics, the page breaks down pod allocation and status by namespace, helping you understand how workloads are distributed and performing across different environments. This granular view enables faster issue identification and better resource planning.
The page also highlights the latest cluster events and errors, offering valuable operational context and early warning signals for troubleshooting. By surfacing real-time alerts and status updates, it empowers teams to respond proactively to anomalies before they impact performance or availability.
With intuitive visuals and detailed insights, the Cluster Overview Page is your go-to tool for maintaining visibility, stability, and efficiency across your Kubernetes infrastructure.